I often have customers report their DPM is high and they wonder if there is a way to create an alert for this. Well there is. In this guide I will walk you through how to created and test an alert for High DPM in your Grafana Cloud Stack.
What is DPM?
DPM stands for data points per minute. It is a measure of metrics ingestion into Grafana Cloud metrics. In Grafana Cloud a DPM of 1 means that Grafana cloud is receiving unique metrics every minute.
What causes high DPM?
There are two common causes for DPM higher than 1. Your collectors have a scape interval that is lower than every 60 seconds. Or you are scraping the same metrics more than once. For example scraping a Kubernetes cluster and a container at the same time.
How do I alert for high DPM?
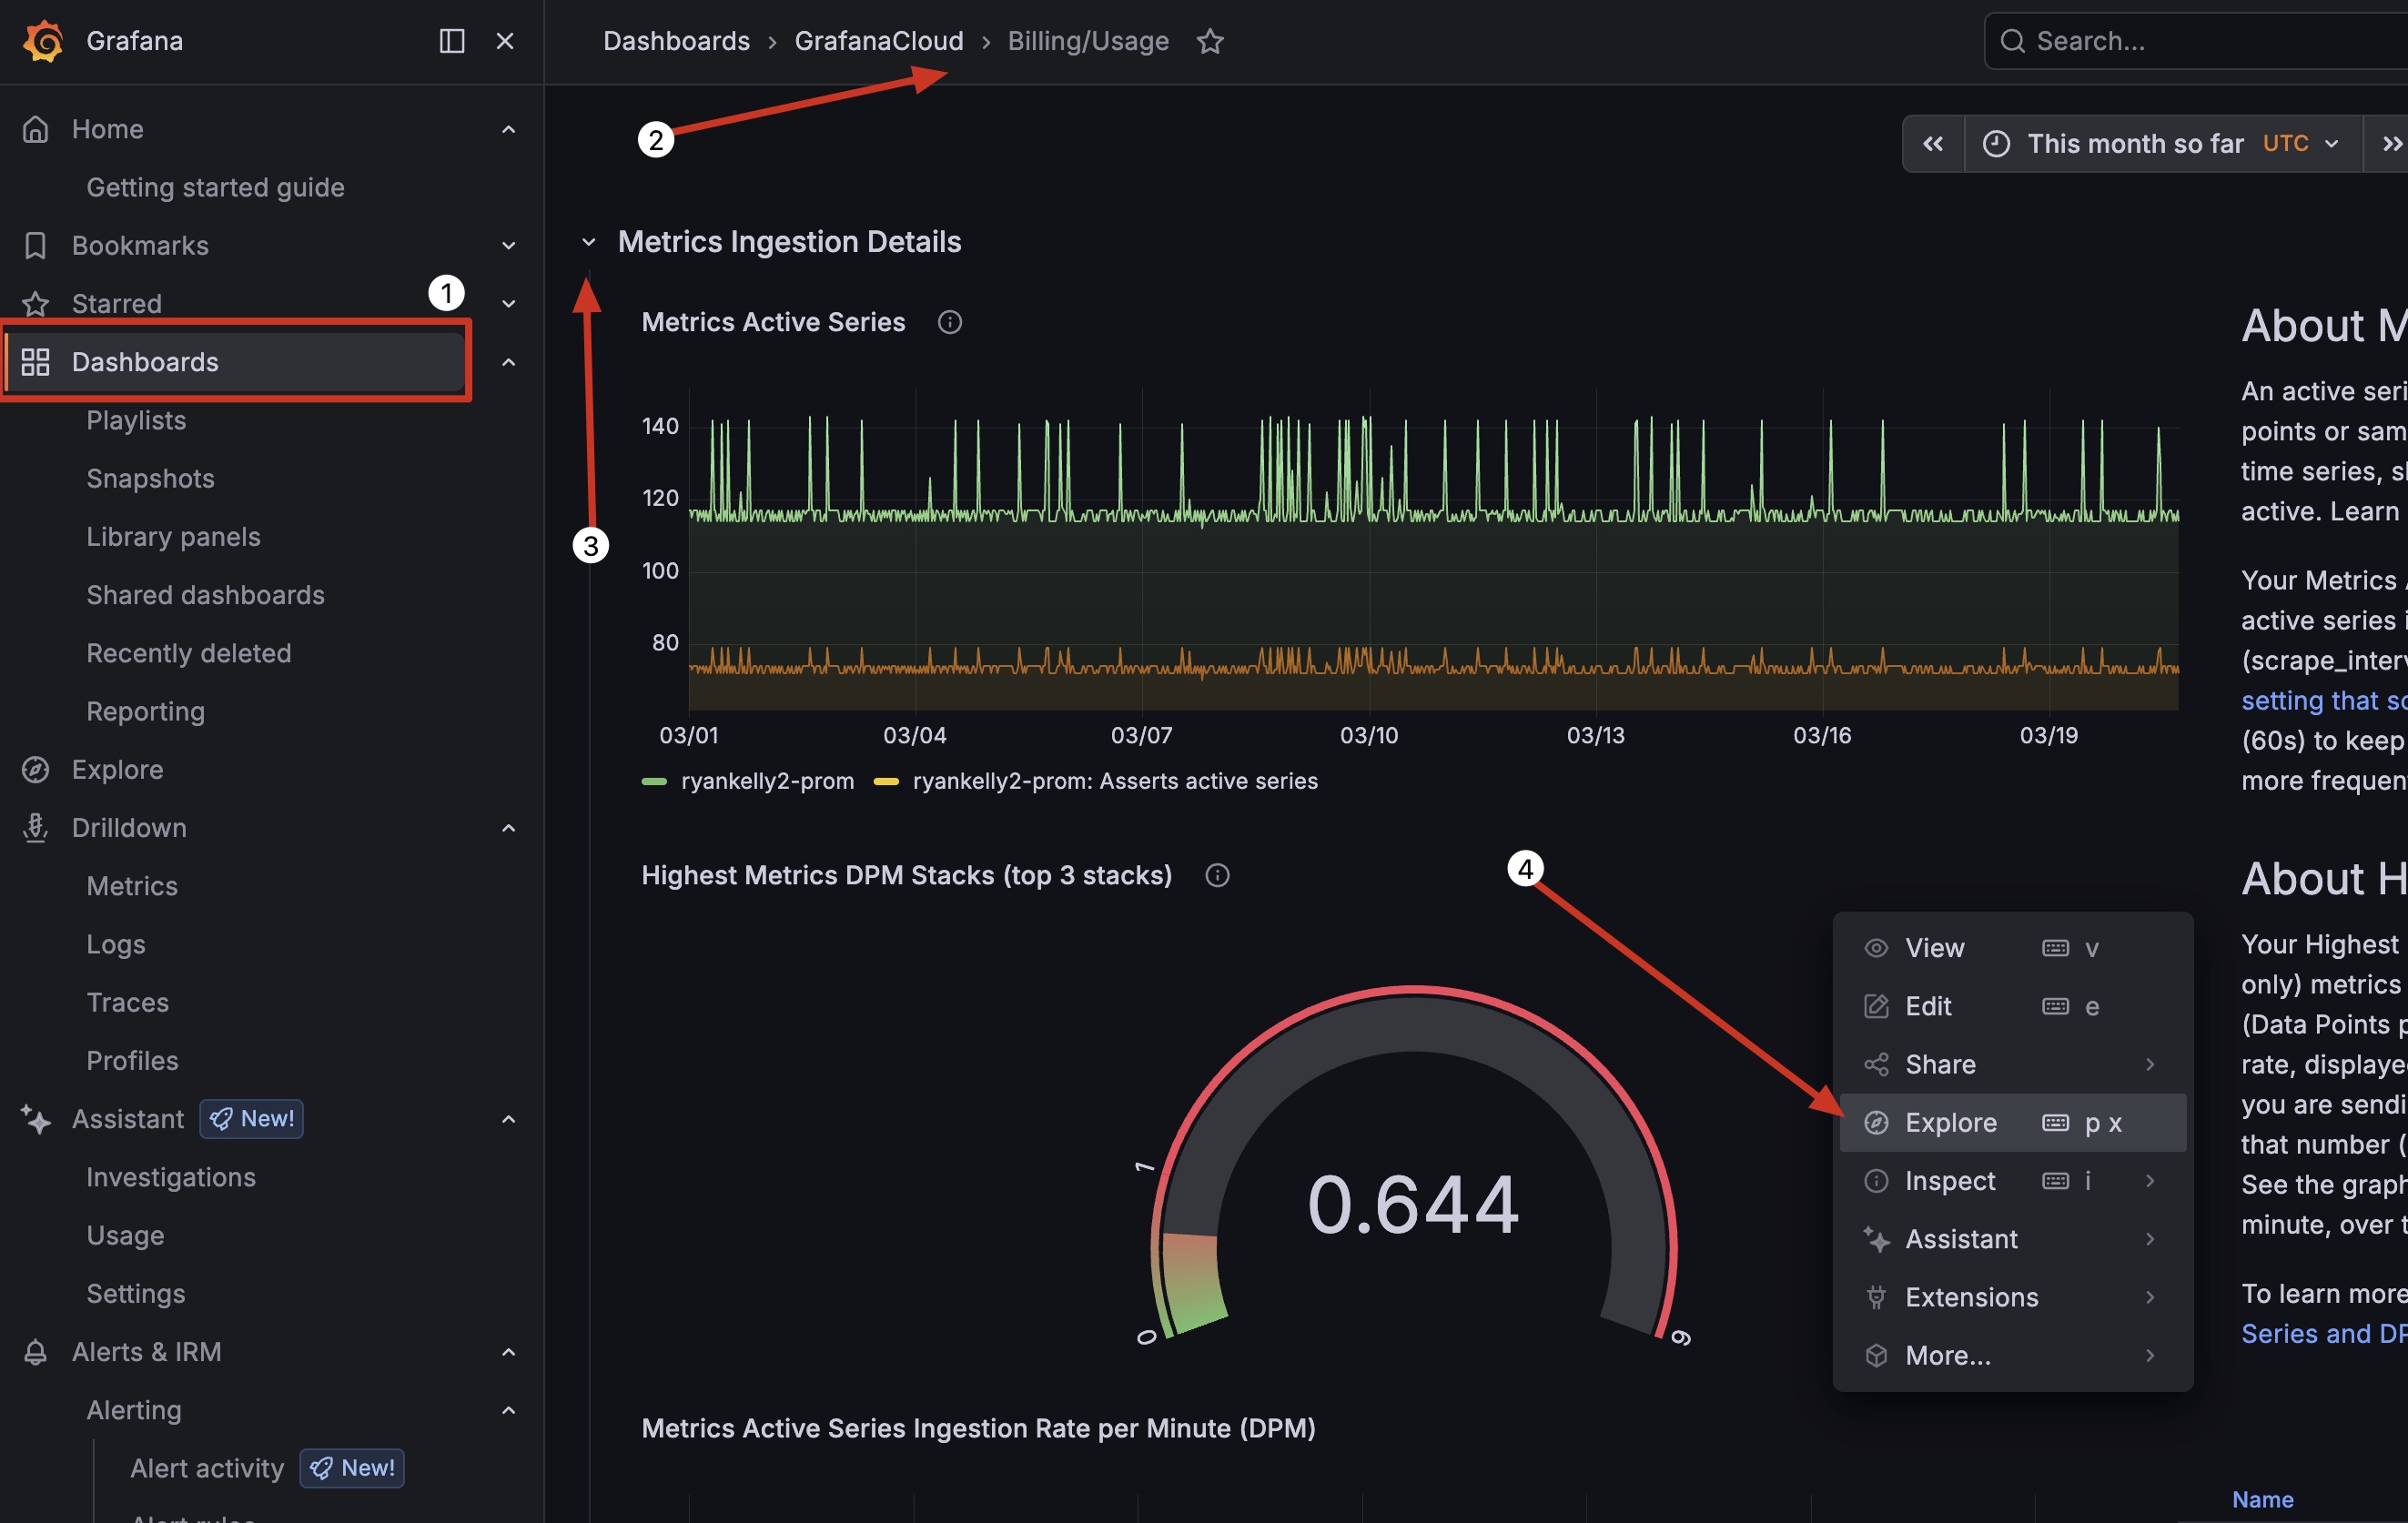
Login to your cloud stack and navigate to your Billing Dashboard, expand Metrics ingestion details, then click 3 dots on the Highest Metrics DPM Panel and click explore
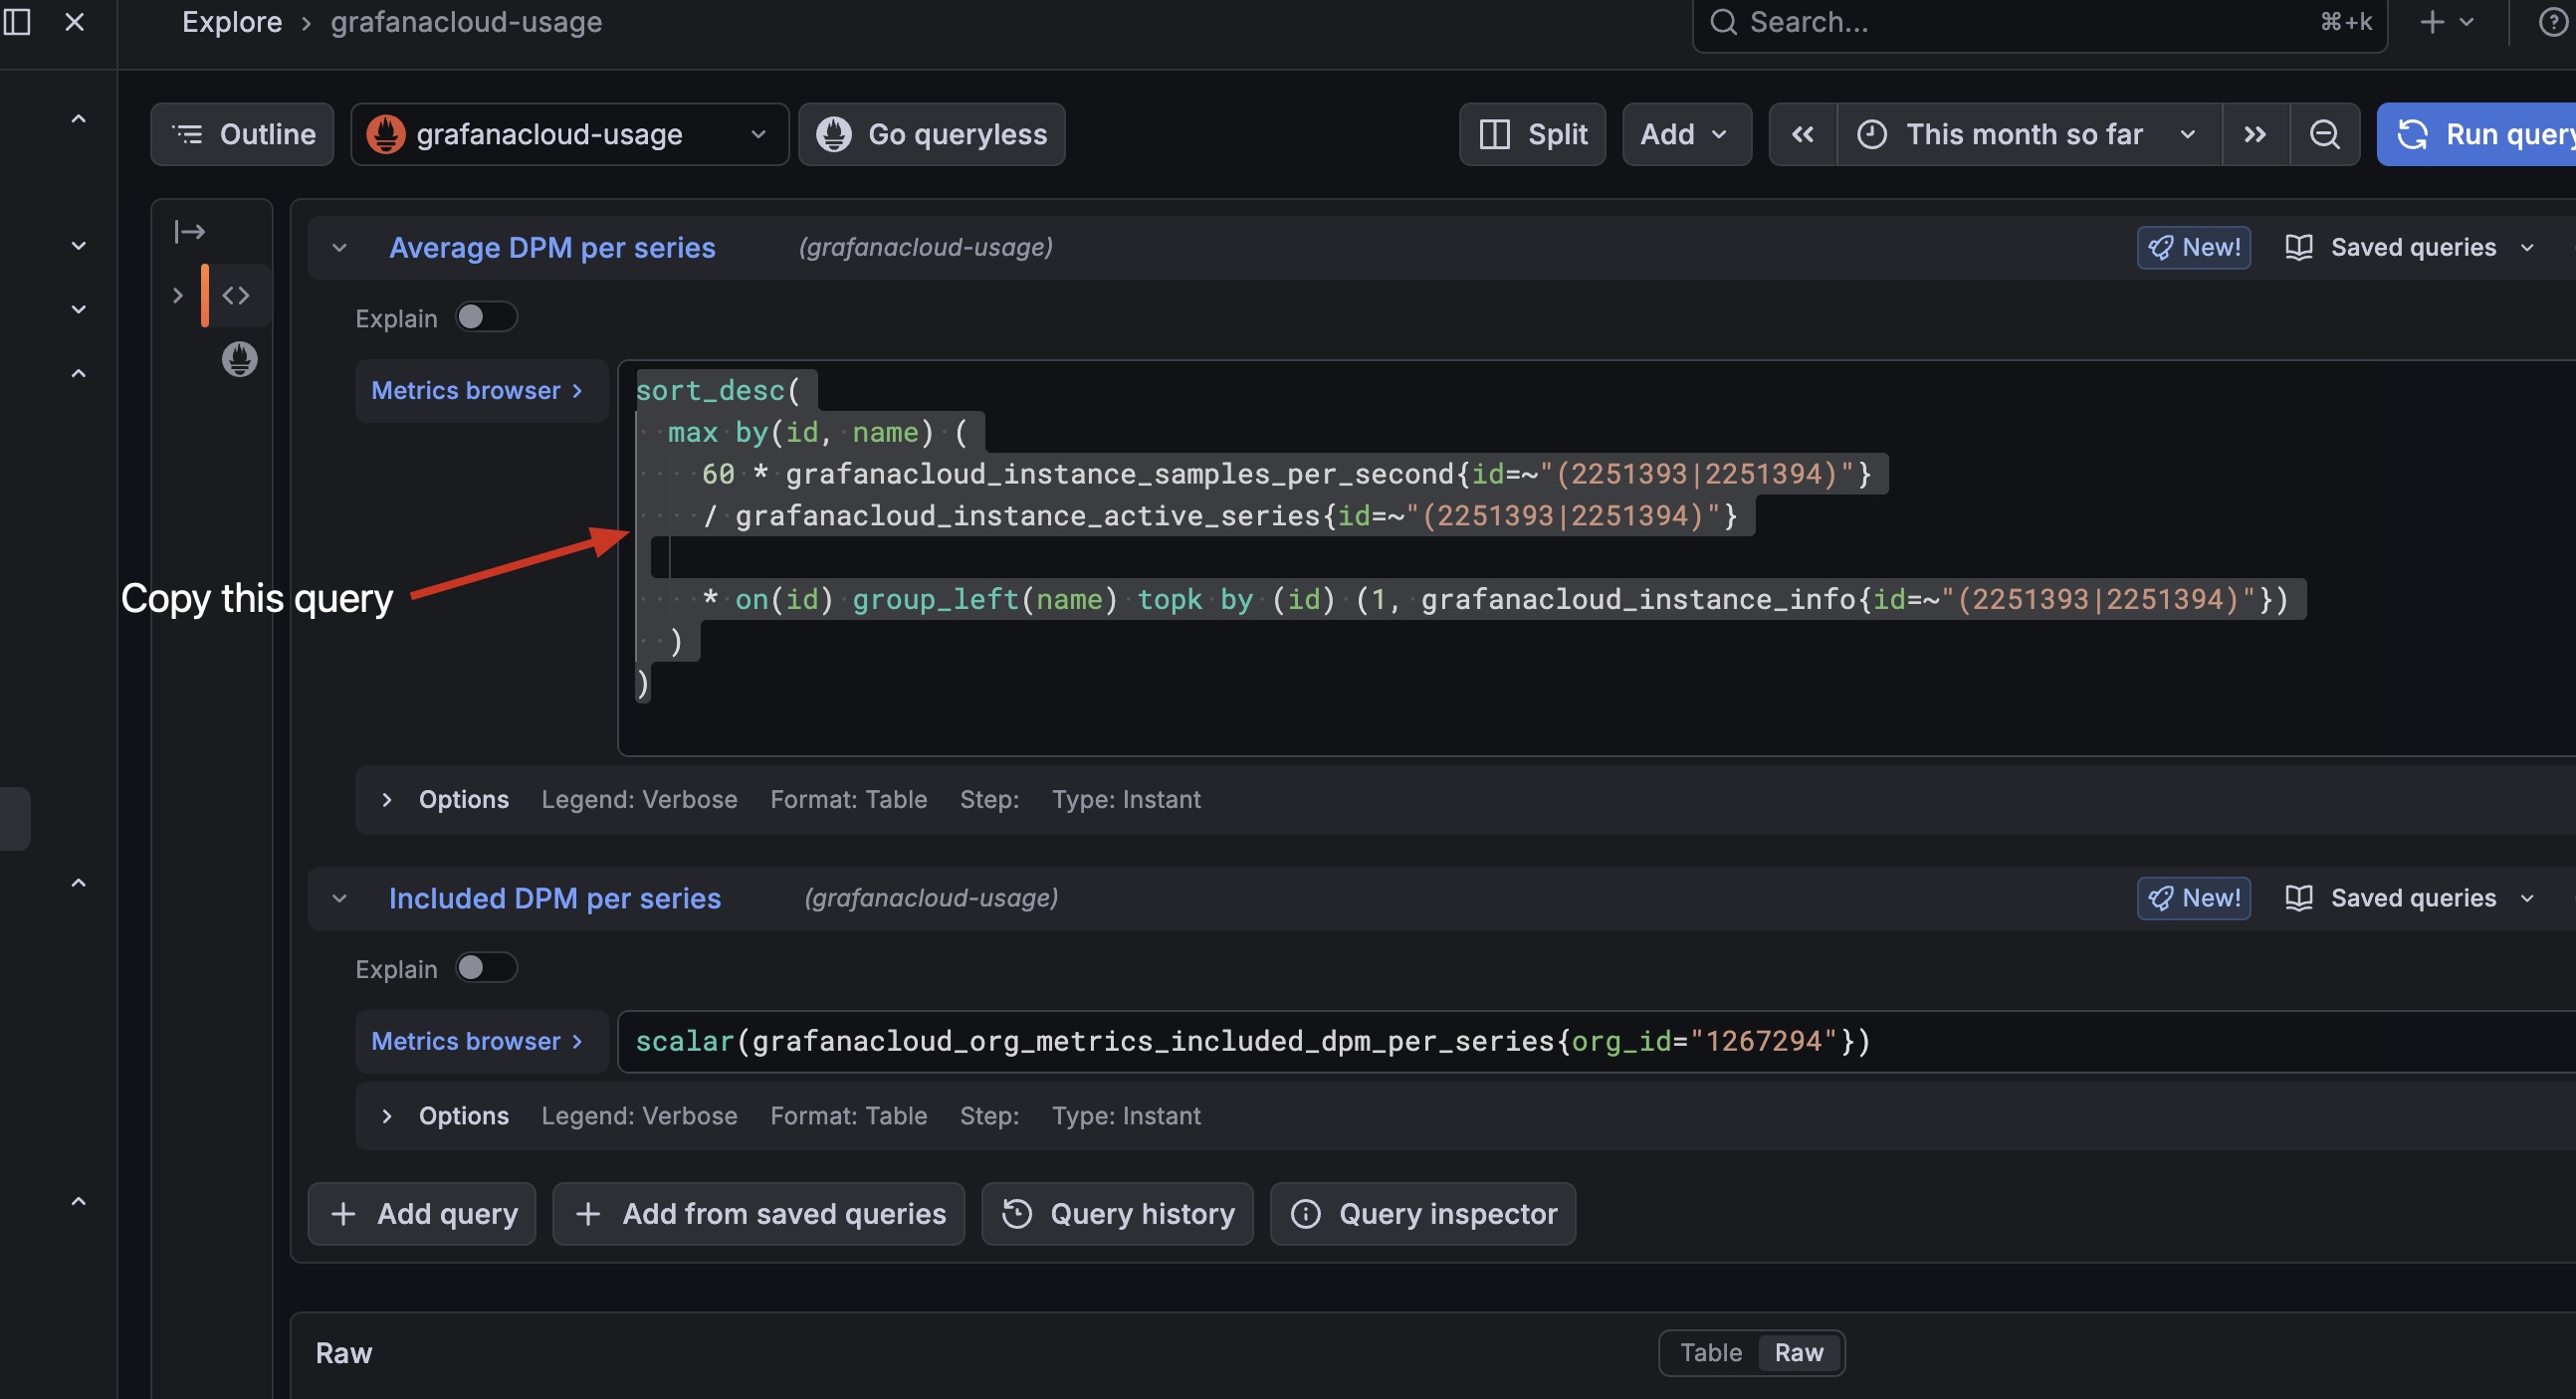
Copy the first query
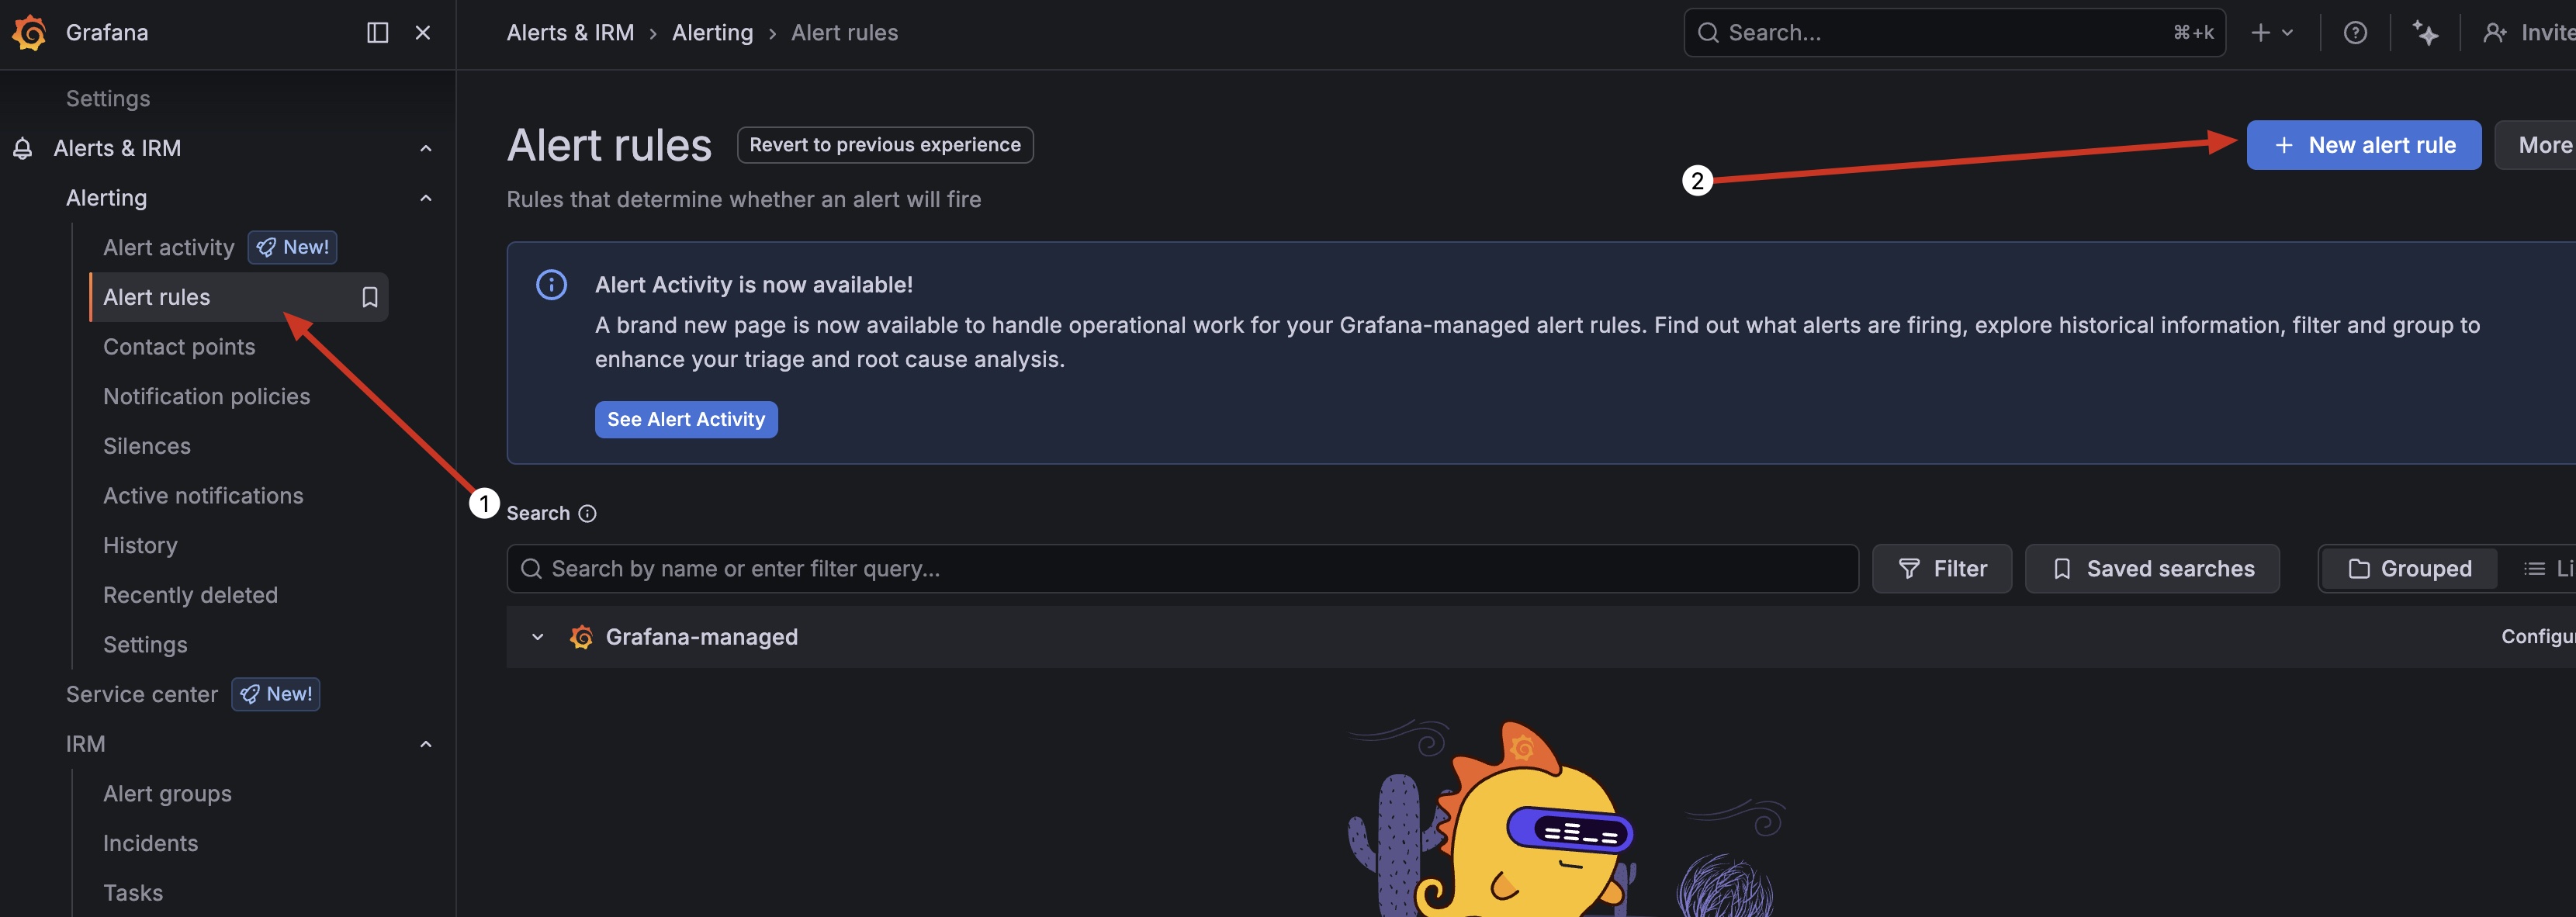
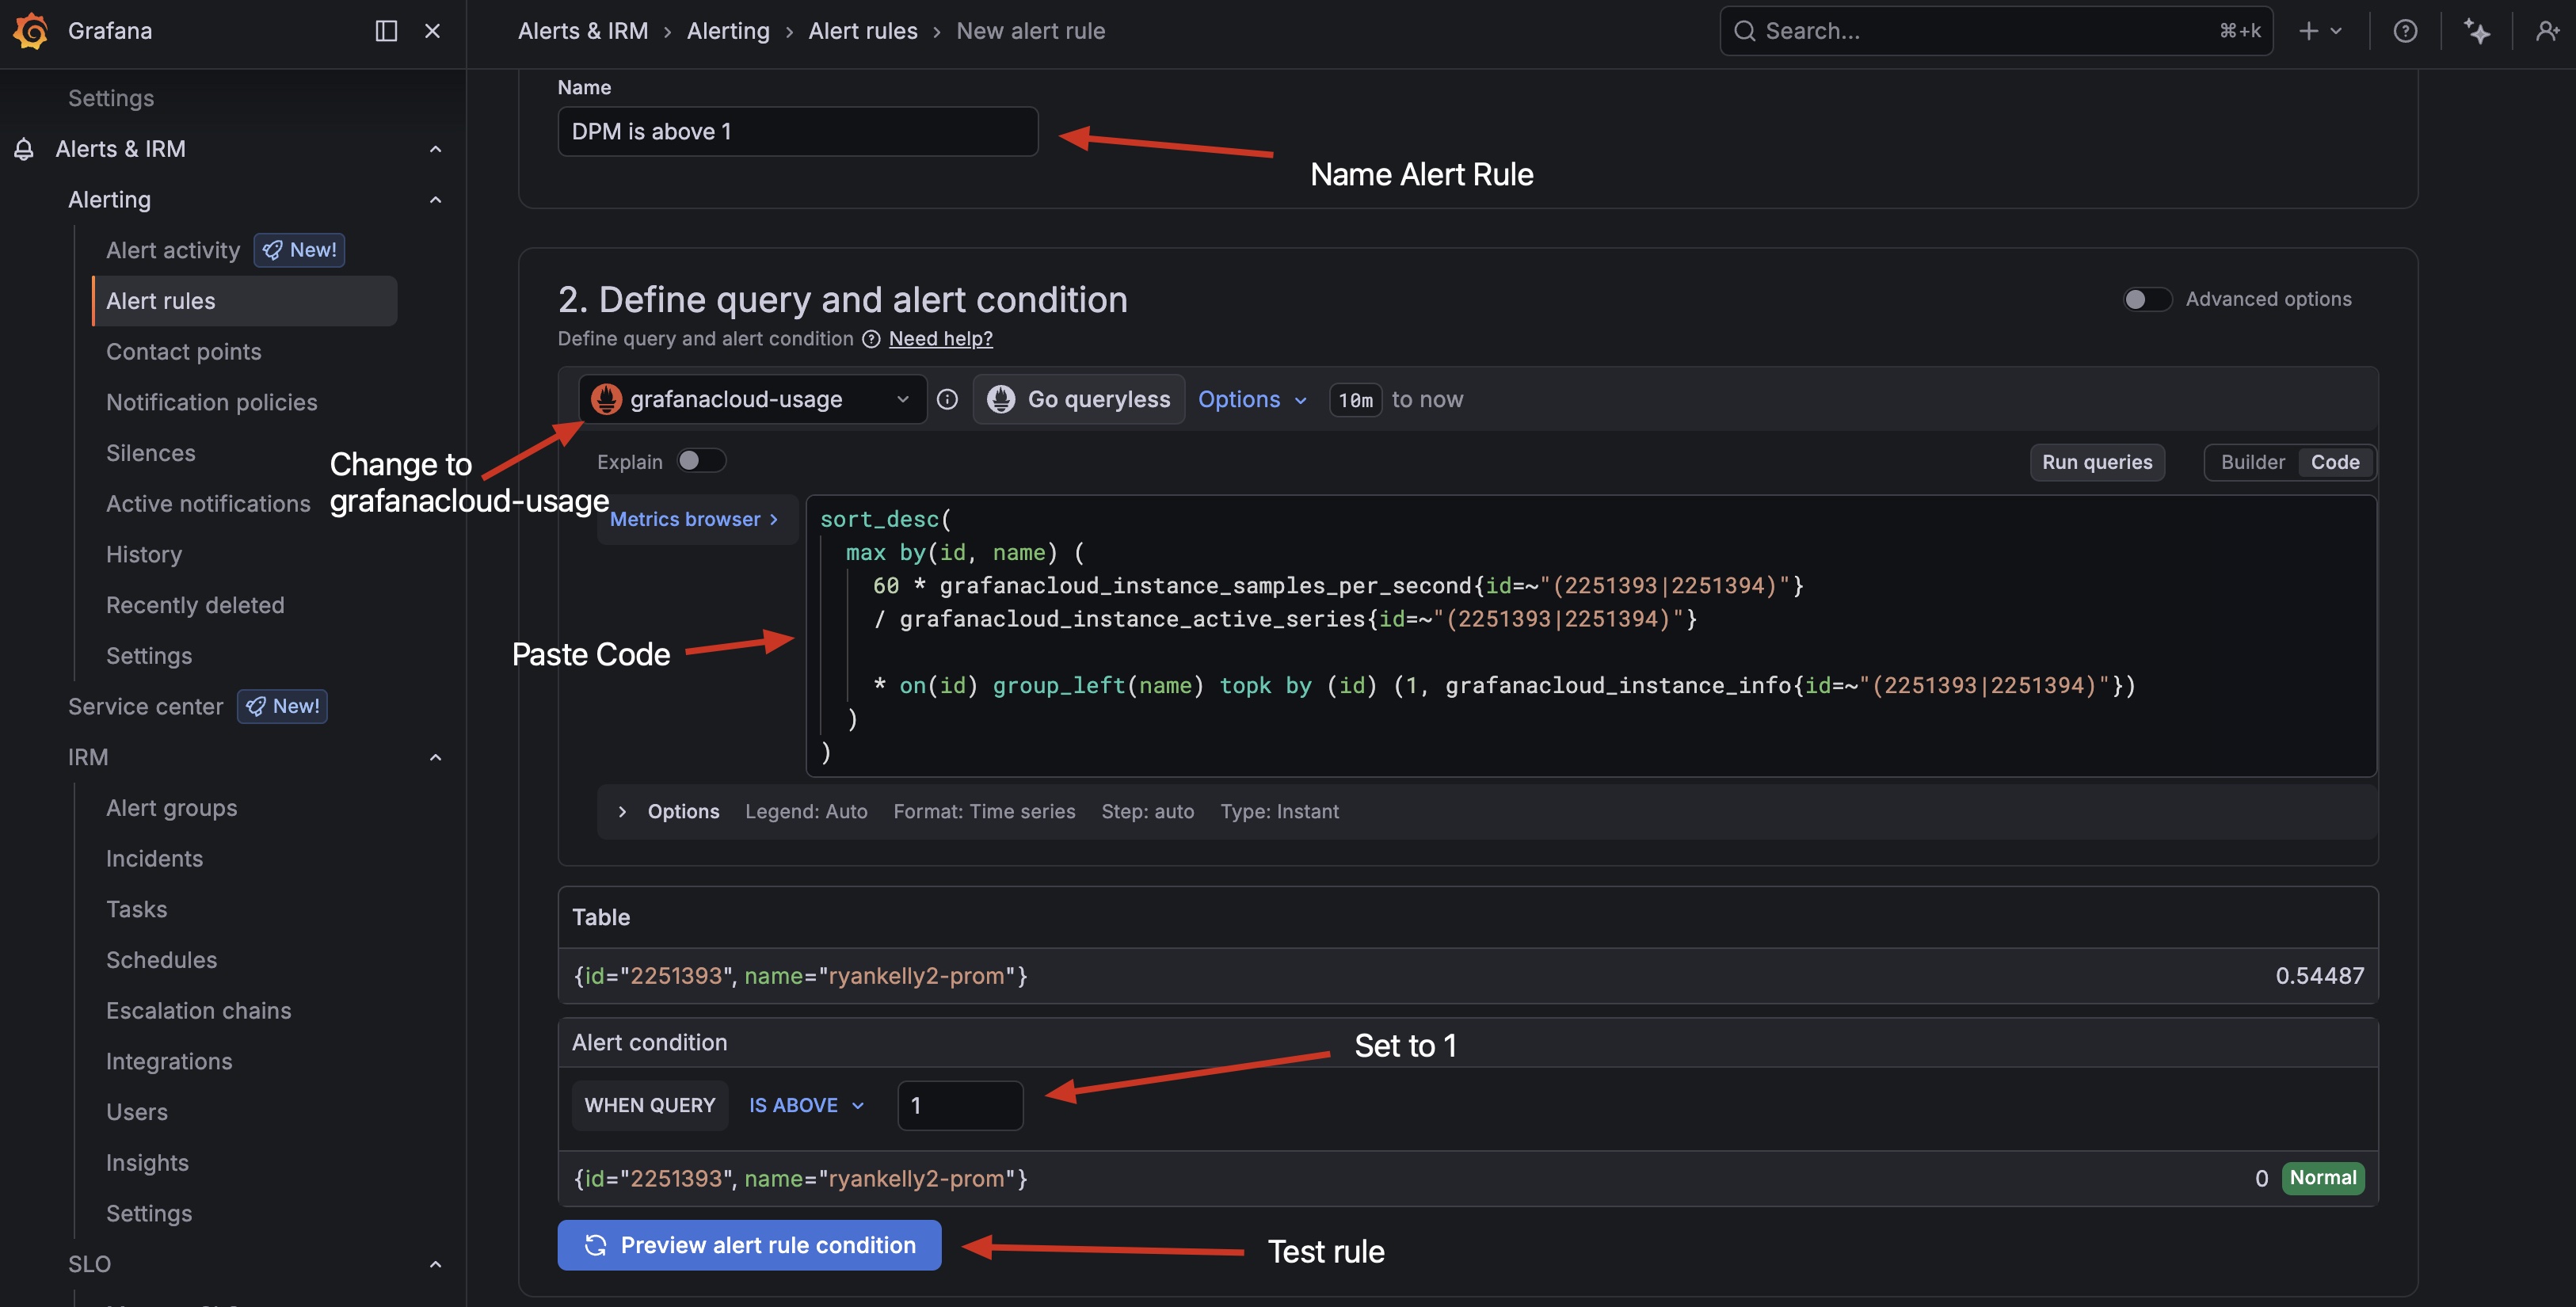
Now Create a new alert rule
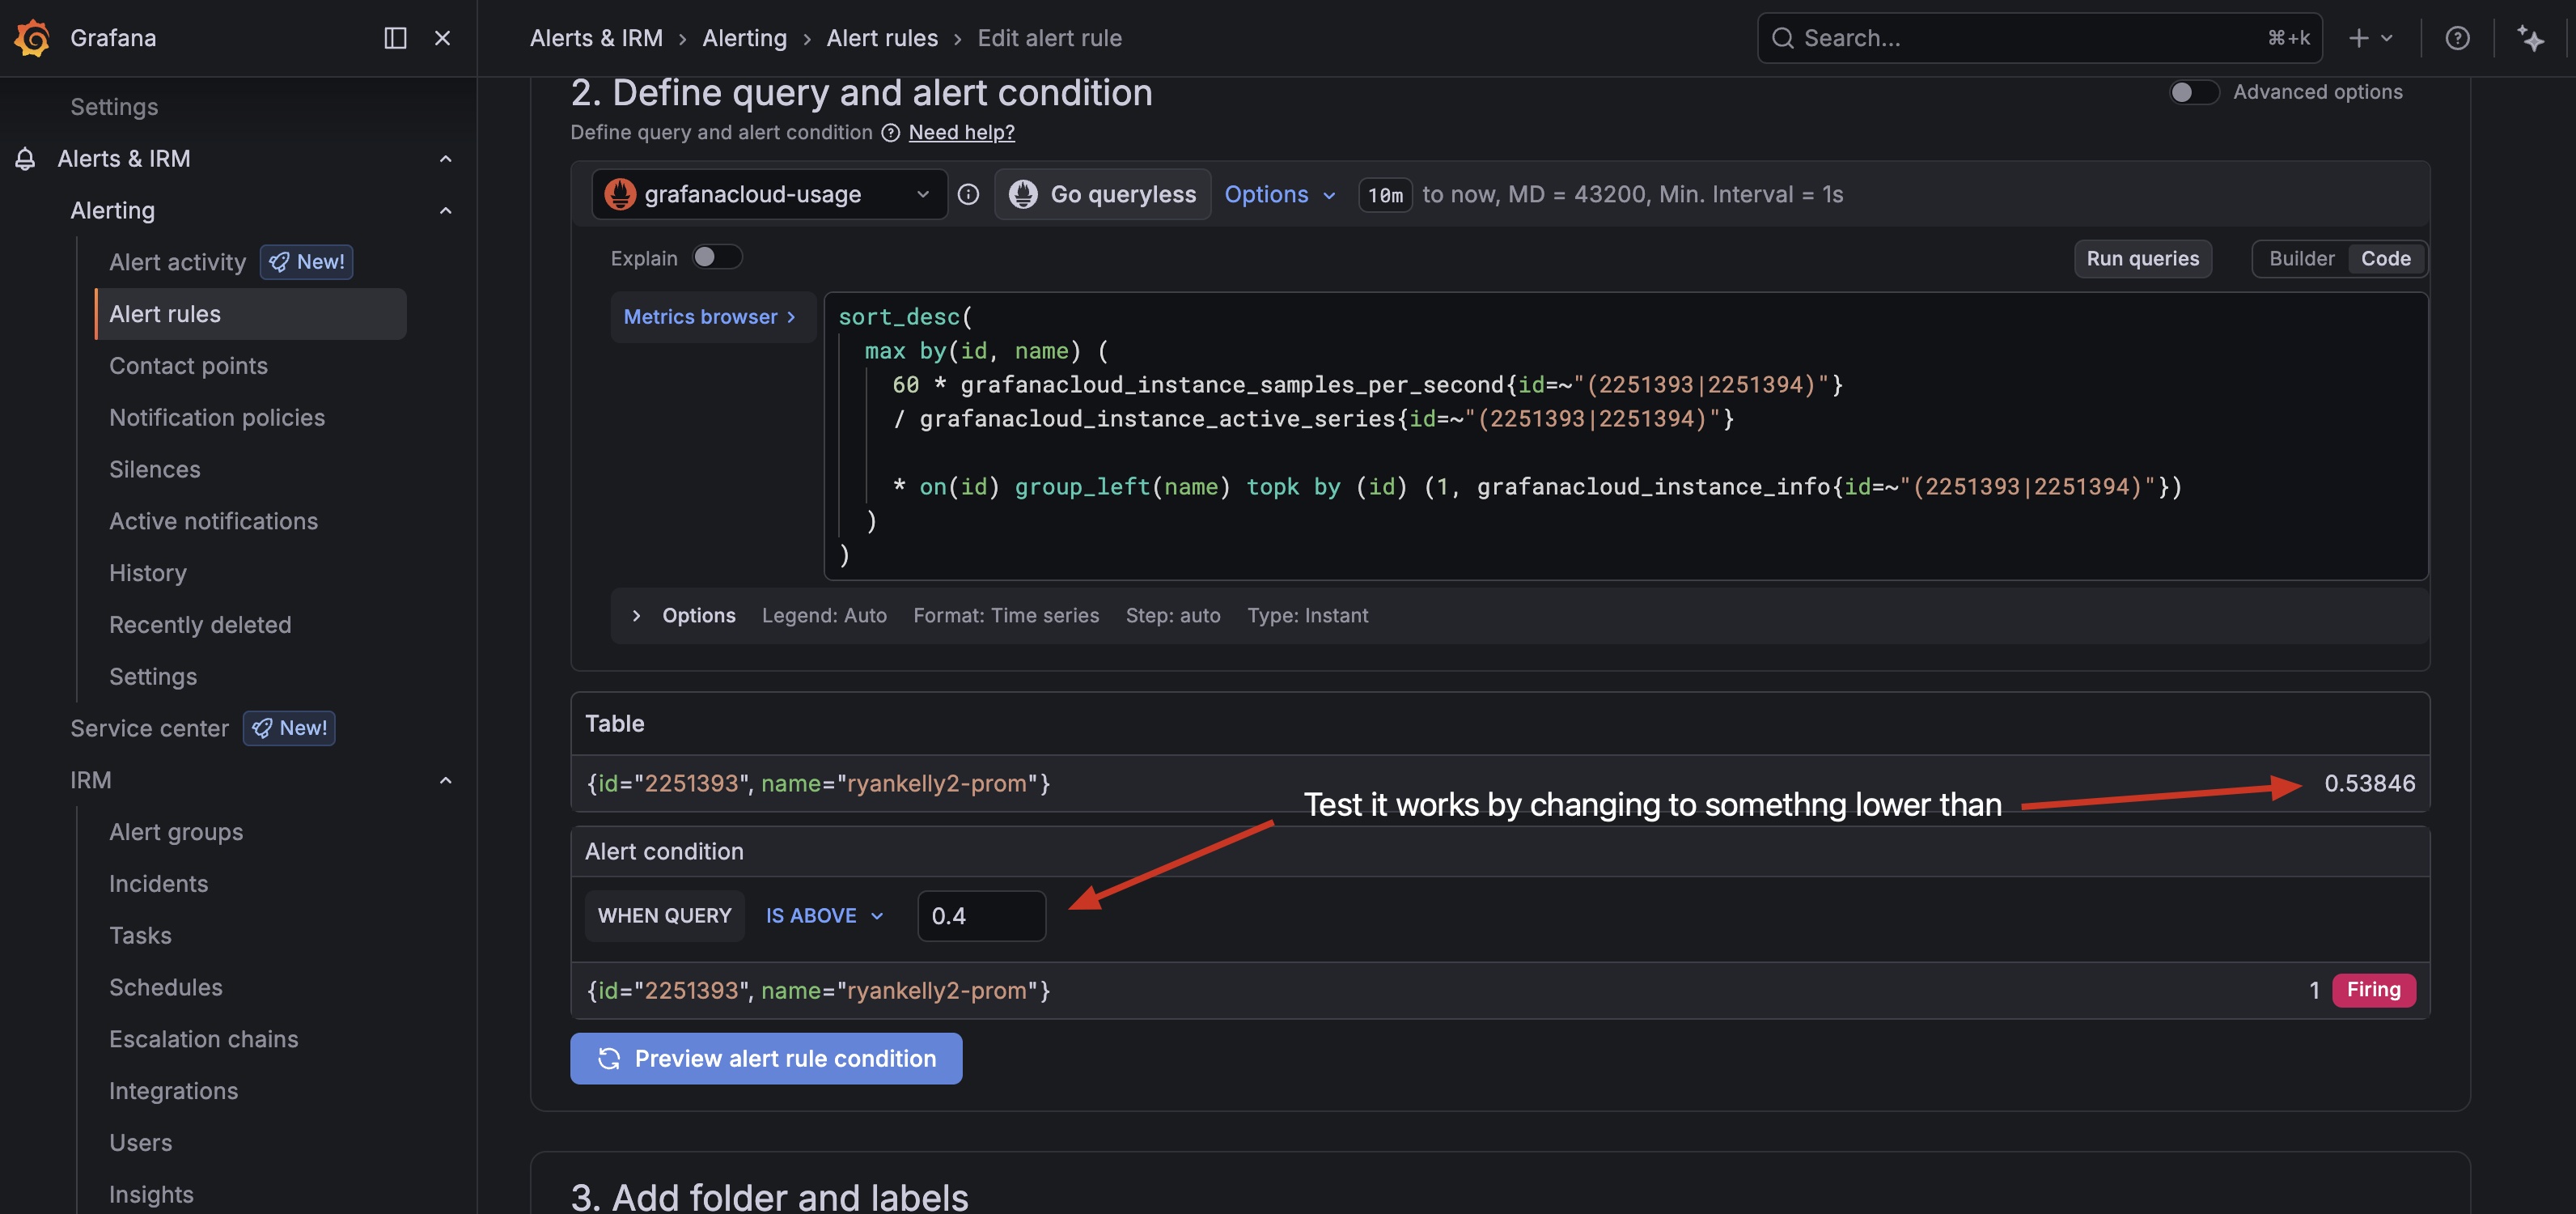
Name the alert rule, change datasource to cloud usage, paste the query code you copied earlier and set the rule to 1 and test it
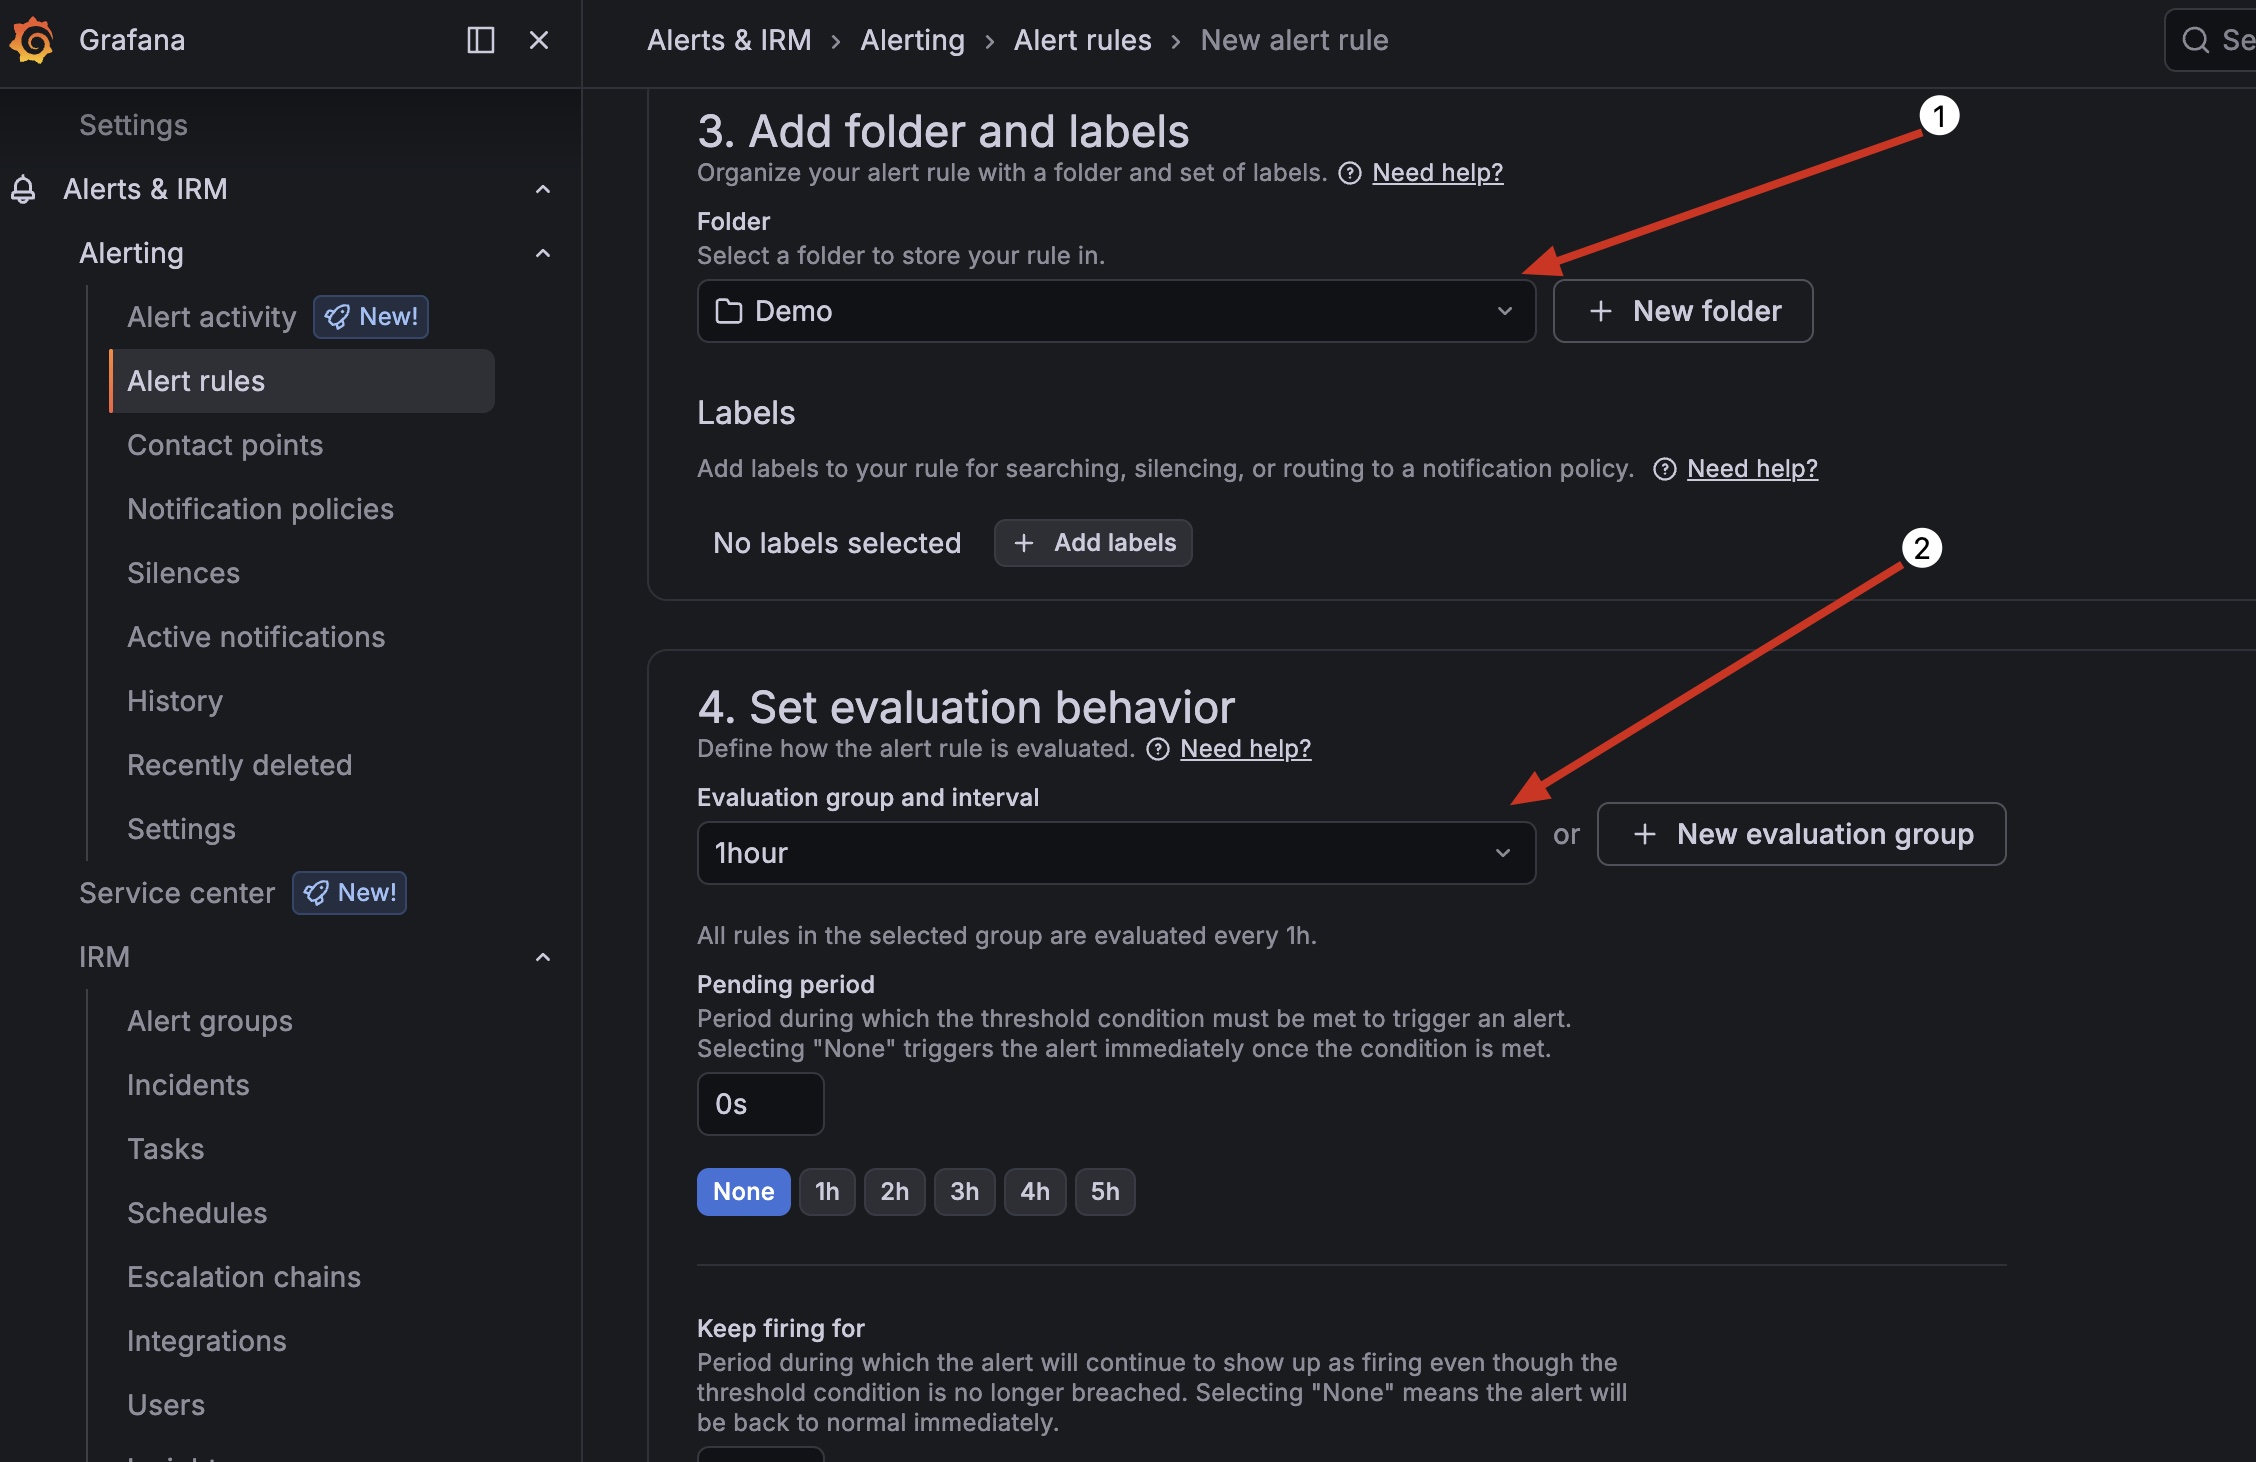
Set the folder and evaluation period once a day is safe but you can set it to what ever you feel comfortable with.
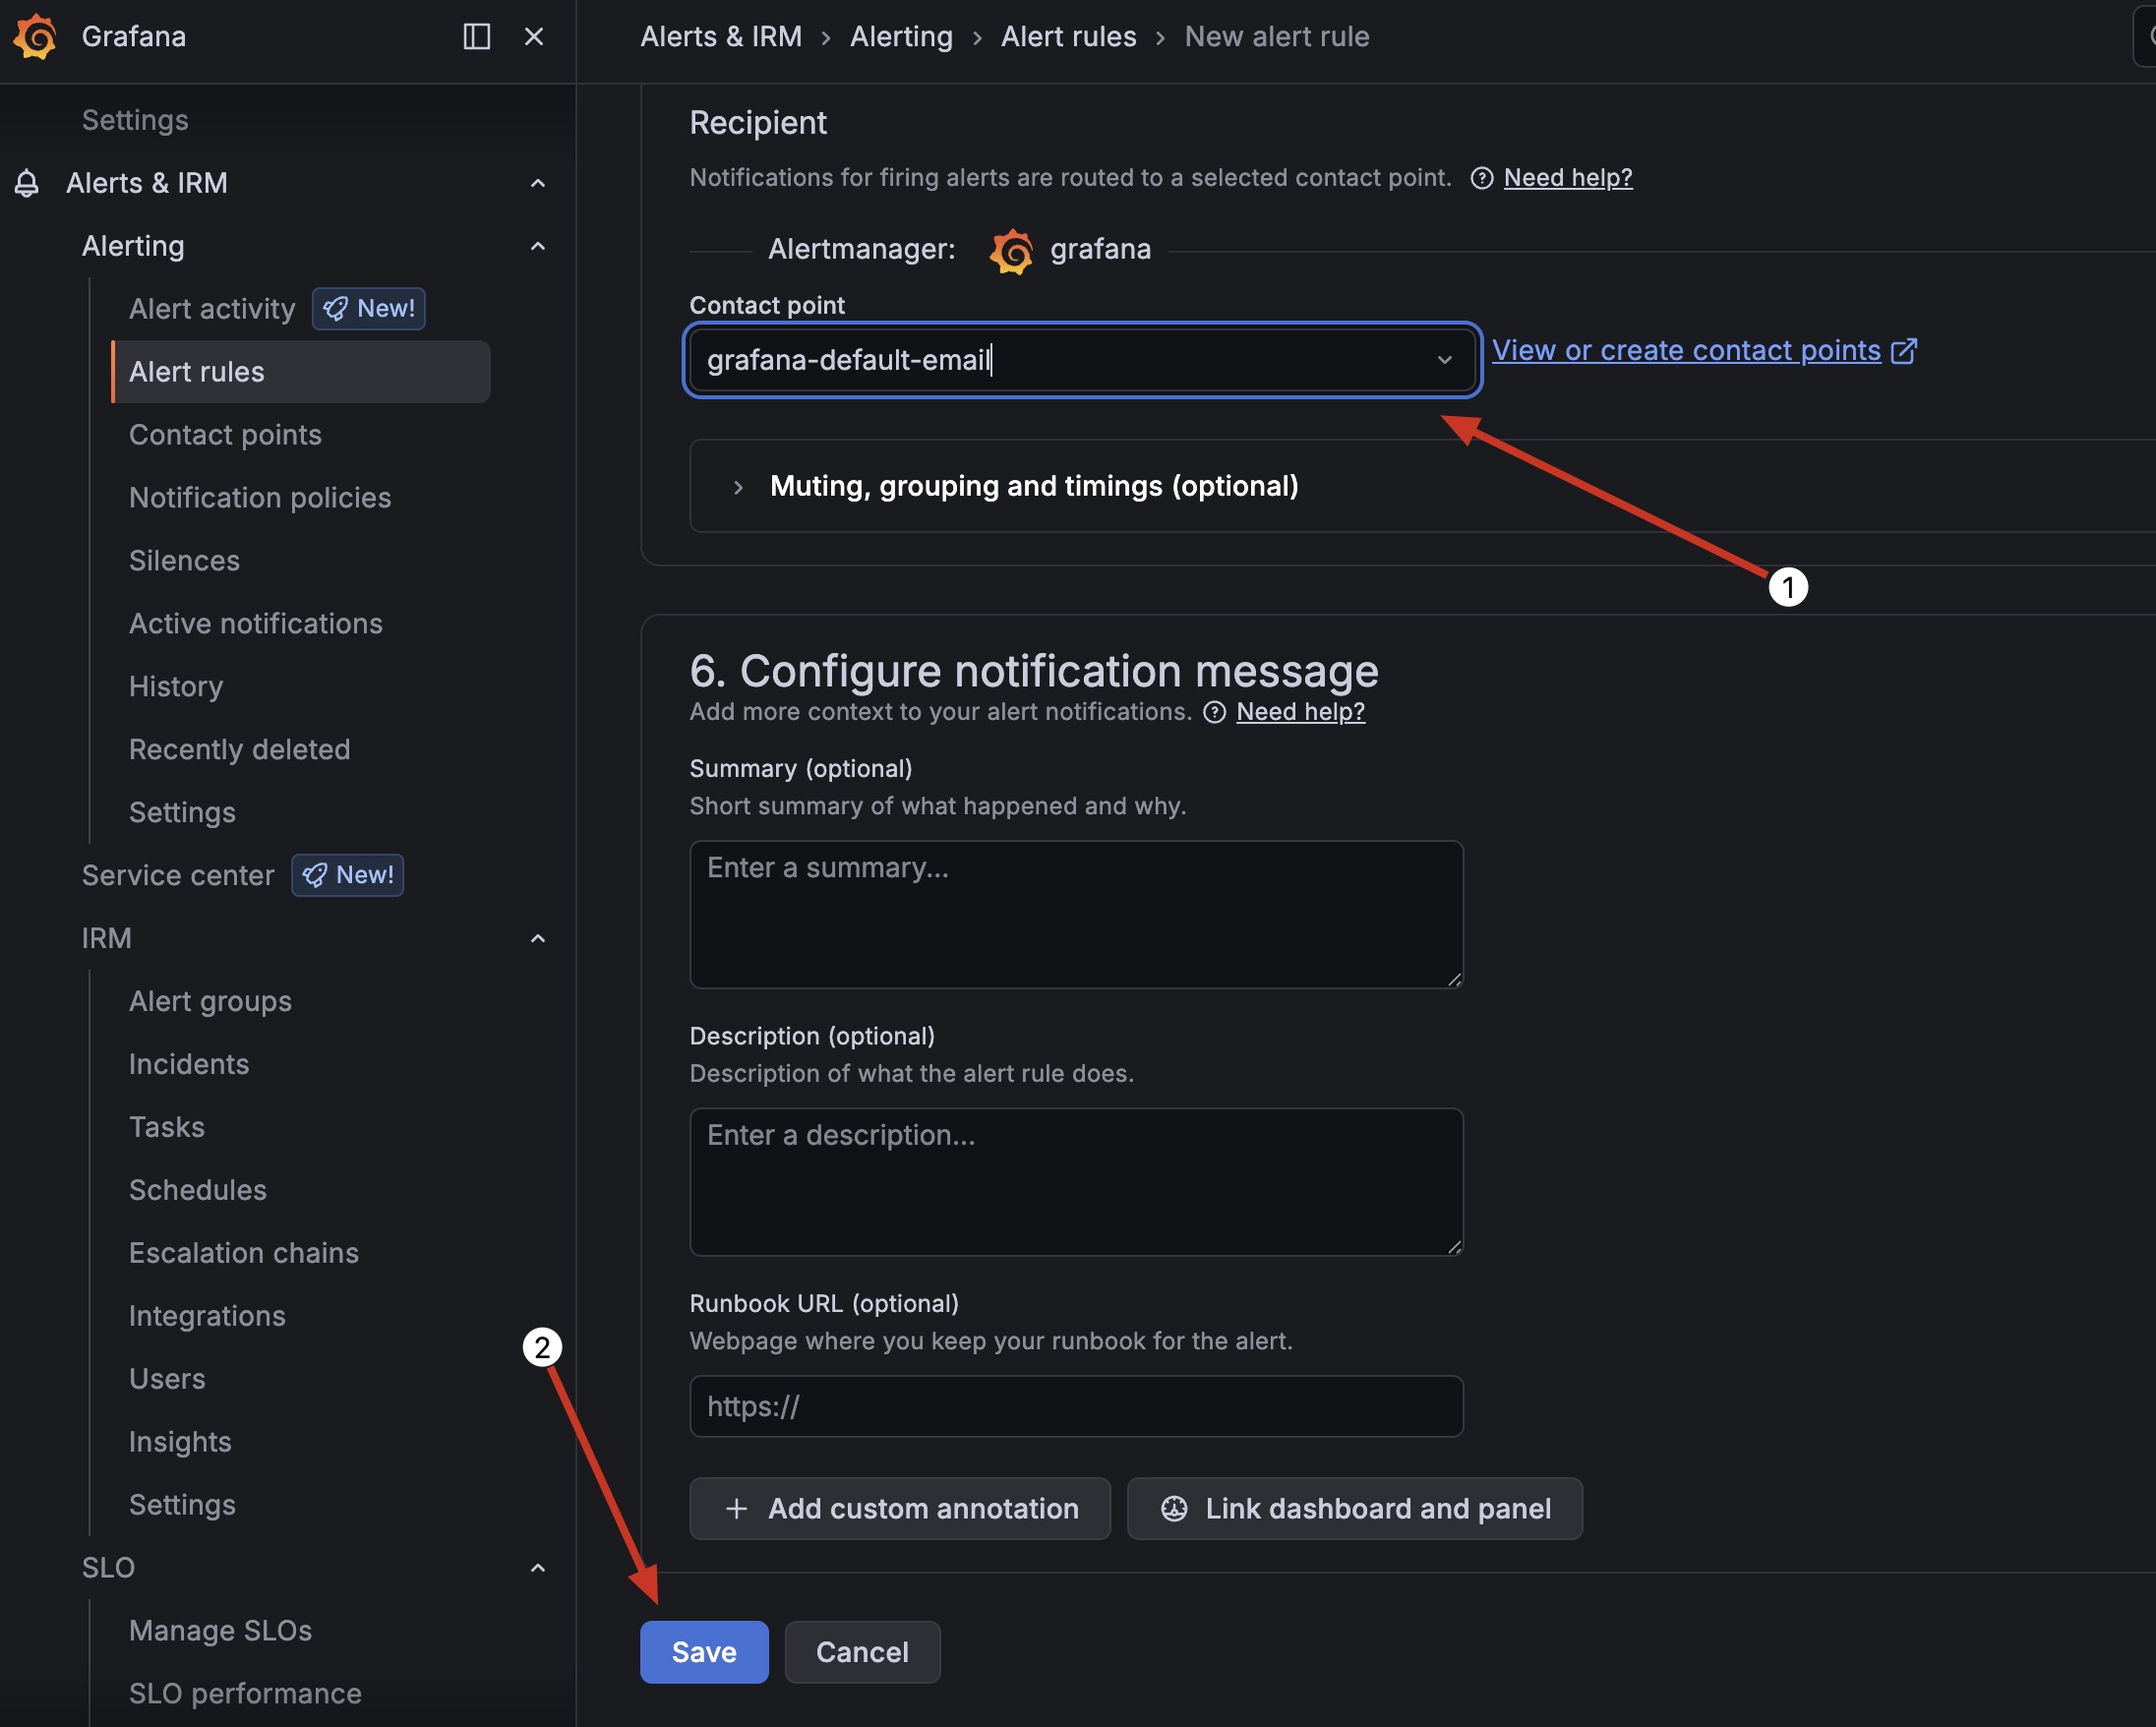
Set the contact point and save it. I just used my e-mail address as the Contact Point
If you want to test and verify it works, just Edit the rule and change the “is above” from 1 to something lower than current DPM, save it and wait for the evaluation interval to pass.